-----------------------------
CFA 2017 L3 STUDY NOTES
-----------------------------
SS1 | SS8 | SS9
| SS12 | SS14 | SS16 | SS17
SS1 CODE OF ETHICS
& STANDARDS OF PROFESSIONAL CONDUCT
R2 Guidance for Standards I-VII
|
Standards of professional conduct:
1.
Professionalism
A.
Knowledge of the law
B.
Independence & objectivity
C.
Misrepresentation
D.
Misconduct
2.
Integrity of capital markets
A.
Material nonpublic
information
B.
Market manipulation
3.
Duties to clients
A.
Loyalty, prudence & care
B.
Fair dealing
C.
Suitability: client-investment mandated
objectives/constraints
1.
Advisory role
2.
Managing role
D.
Performance presentation
E.
Preservation of confidentiality:
unless
1.
Illegal activities info
2.
Disclosure required by law
3.
Client permits disclosure
|
4.
Duties to employers
A.
Loyalty
B.
Additional compensation
arrangements
C.
Responsibilities of supervisors
5.
Investment analysis,
recommendations & actions
A.
Diligence & reasonable basis: (1) & (2)
B.
Communication with (prospective) clients:
1.
Disclose basic format,
general principles clients use
2.
Disclose significant limitations/risks
3.
Use reasonable judgment
in identifying important factors
4.
Distinguish between fact
& opinion
C.
Record retention
6.
Conflicts of interest
A.
Disclosure of conflicts
B.
Priority of transactions
C.
Referral fees
7.
Responsibilities as a CFA
Institute member/candidate
A.
Conduct as participants in CFA Institute programs
B.
Reference to CFA Institute, designation, program
|
SS8 ASSET
ALLOCATION & RELATED DECISIONS IN PORTFOLIO MANAGEMENT (1)
R17 Asset Allocation
|
1.
Strategic asset allocation (SAA): based on long-run capital market
expectations & IPS; long term policy target portfolio
2.
Tactical asset allocation (TAA): deviation from SAA or benchmark
to take advantage of perceived short-term (mean reverting returns to long
term level) opportunities (mispricing) in the market; increment
to SAA not replacement (small increment in return); undertaken infrequently
or regularly by monitoring the market and reacting
accordingly; active management (if value added > costs, internally
or by outside firm)
1.
Loss aversion: take greater risk to recover from a loss
2.
Mental accounting: identifying & immunizing individual goals;
more important less risk; pyramid
3.
Regret: bad feeling/disappointment/shame from
admitting bad decision; avoided if not recognized (loss)
4.
Fear of regret: avoid taking actions that could lead to
regret
|
Asset/liability management (ALM) approach: SAA based on liability
modeling (not asset-only approach)
1.
Static asset allocation: no link for asset allocation between different
time periods
2.
Dynamic asset allocation: multi-period view of investment horizon; Monte
Carlo simulation; unanticipated changes; difficult & costly;
ALM
Utility risk-adjusted return: return, risk aversion score, variance
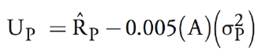 also 0.5 for decimal % also 0.5 for decimal %
Roy�s safety-first measure (shortfall/downside risk):
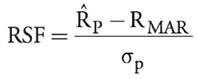 return, min acceptable return, σ return, min acceptable return, σ
|
|
Asset classes:
1.
Contain similar assets
from a descriptive & statistical perspective
2.
Are not highly correlated
to provide diversification
3.
Should be mutually exclusive
(each asset only in one class)
4.
Cover majority of investable
assets (exhaustive)
5.
Have sufficient liquidity
for rebalancing
Adding a class: theoretical effects (risk, return,
correlation), practical effects (liquidity, legal, tax, political,
currency); a class could be added just for TAA; distinct classes: TIPS
(inflation), international investments (return) & alternative assets
(diversification); decision to add class/security:
if� 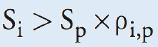 �Sharpe ratios, correlation �Sharpe ratios, correlation
Asset allocation process:
1.
Determine IPS &
formulate capital market expectations
2.
Determine asset allocation (appropriate mix) & construct portfolio; TAA
also considered
3.
Monitor & revise allocation & portfolio
accordingly
CAL/CML allocation = risk free asset + tangency portfolio
(highest Sharpe ratio corner portfolio = market); risk
free lending (Rp < Rm) or borrowing if possible (Rm < Rp)
|
International assets:
1.
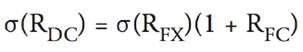
Currency risk: local market return (LCM) + local currency
return (LCR), if correlation +/- high/low volatility;
small impact over currencies & time; σ bonds < FX < stocks
2.
Political risk: monetary & fiscal policy, legal &
regulatory rules, FDI, capital flows
3.
Home country bias: overweight domestic investments; lack of familiarity;
match domestic assets/liabilities
Costs: high transaction costs (market impact),
withholding taxes & DTT issues, free-float issues,
inefficient market infrastructure;� currency devaluation; crisis
contagion (high correlation, instead use conditional return correlation
depending on volatility level)
Opportunities (also emerging markets): long-run diversification
(decline over time, integration); foreign undervaluation; economic growth;
bonds less correlated than stocks
Segmented to integrated market: share price rise, expected return increase &
decrease, stand-alone risk decrease (variance down), efficiency increase,
diversification benefits decline (covariance up)
Corner portfolios: define segment adjacently with same assets
(shift when weights go +/0 or 0/+) & constant rate of
change of weights; include global minimum variance portfolio (GMVP); efficient
portfolios are linear combinations (interpolations) of adjacent
corner portfolios; 2-porfolio/(corner portfolio) theorem in
unconstrained/constrained (0 or positive weight) optimization
|
|
Asset allocation approaches
|
|
Mean variance optimization (MVO)
|
|
Resampled efficient frontier (REF)
|
|
Black-Litterman model (BL)
|
|
Monte Carlo simulation (MCS)
|
|
Surplus asset liability management (ALM)
|
|
Experience based techniques (EBTs)
|
SS9 ASSET
ALLOCATION & RELATED DECISIONS IN PORTFOLIO MANAGEMENT (2)
R18 Currency Management: An
Introduction
|
Exchange rate = (price currency)/(base currency);
buy or sell base currency in units of price currency; T+2; quotes: bid/ask
price, (receive less, buy)/(deliver more, sell) of price currency
Mark to market = PV of gain/loss
FX swap: roll over forward with spot; call option to buy
one currency = put option to sell other currency (out of/at/in the
money)
|
|
R19 Market Indexes & Benchmarks
|
5.
Index: represents the performance of a
specified group of securities
6.
Benchmark: reference point for evaluating
portfolio performance (indexes are often used as benchmarks)
Market index uses:
1.
Asset allocation proxies
(risk/return of classes)
2.
Investment management mandates
(specifying style ex-ante)
3.
Performance benchmark & portfolio analysis/attribution (evaluating
results ex-post, GIPS, legal compliance)
4.
Gauging market sentiments
5.
Design of index funds, ETFs, derivatives (passive
investment)
|
1.
Asset-based benchmarks: focus on assets/returns
& the ability of managers to meet/exceed them
2.
Liability-based benchmarks: focus on liabilities/payments
& the ability to meet/fund them (duration matching, relatively low risk)
Index construction tradeoffs:
1.
Completeness vs investability (liquidity & ownership
constraints)
2.
Reconstitution (addition/removal of securities) & rebalancing
(adjustment of weights) frequency to align characteristics vs low turnover
(transaction costs)
3.
Objective & transparent rules
vs subjective judgement
|
SS12
EQUITY PORTFOLIO MANAGEMENT
R23 Equity Portfolio Management
|
Equity (US 50%, EU 25% allocation):
1.
Passive management: indexing (minor)
2.
Semiactive/risk-controlled active management:
enhanced indexing; highest IR
3.
Active management: highest active return & risk
|
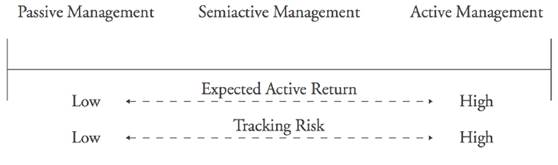
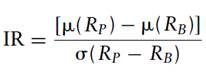
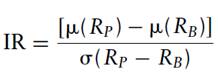
Information ratio (IR) = active return / tracking risk TE(V)
|
|
good inflation hedge (low
taxes, low competition)
|
|
|
|
|
|
Indexes:
1.
Price-weighted index: arithmetic average; adjustments for stock
dividends, stock (reverse) splits & addition/removal of stocks; biased
toward higher priced stocks
2.
Market capitalization value-weighted index: adjustments for stock issues/buybacks &
addition/removal of stocks; biased toward large cap, mature, overvalued
companies; (less diversified)
3.
Free float-adjusted market
capitalization value-weighted
index:
float-weighted, publicly available shares; biased
like market cap
4.
Equal-weighted index:
$ per
stock; periodic rebalancing; biased toward small-cap
Investment costs (high > low):
1.
Index mutual funds: admin
fees, liquidation impacts
2.
ETFs: more tax efficient, higher license fees
3.
Separated & pooled accounts: institutional,
securities lending
4.
Equity futures: finite
live (roll over), basket shorting/uptick rule
5.
Equity total return swaps:
cheap, tax advantages, TAA
|
Indexed portfolios (combinations possible):
1.
Full replication: < 1000, liquid stocks; self-rebalancing (except
for dividends & adjustments); low TE(V); index return -
admin fees, cash drag (for redemptions) & transaction costs (dividends
reinvestment, reconstitution & rebalancing)
2.
Stratified random sampling/representative sampling: index subset; multidimensional
market cap cell structure/matrix with representative stocks
(random sample) segmented by uncorrelated characteristics
(industry, size, P/E); TE(V) decrease with more cells
(finer divisions); can mimic concentrated positions
3.
Optimization approach: index subset; use of multifactor risk model
to match index factor exposures

accounts for factor dependence; use of objective
function to minimize TE(V) (lower than sampling); data overfitting;
historical bias; needs frequent exposure updates & rebalancing;
many solutions
|
|
Investing style:
1.
Value investing: low P/E, P/B; focus on numerator;
depressed earnings will rise as reverting to the mean; low turnover; substyles:
high dividend yield, low price multiples & contrarian
2.
Growth investing: high P/E, P/B; focus on denominator;
earnings growth; do better during economic contraction; high turnover; substyles:
consistent earnings growth & momentum (RSI)
3.
Market-oriented/core/blend investing: must outperform
broad market indexing strategies; substyles: value tilt, growth
tilt, growth at reasonable price (GARP), style rotation
Market capitalization-based investing: micro-cap, small-cap, mid-cap, large-cap
Style indices: value, growth, blend/neutral; holding-based
construction by assigning securities by category (no overlap) or by quantity
(market cap category split, overlap); buffering rules to reduce
reconstitution
|
Style identification:
1.
Returns-based style analysis (RBSA): weights bi > 0,
Sum(bi) = 1, (i > 0)
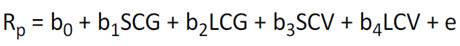
regression
against security indexes (well specified, mutually exclusive &
exhaustive); style fit = coefficient of determination R2
(unexplained variation = 1 - R2, error, selection return); construction
of custom/normal benchmark with bi weights (regression
coefficients)
2.
Holdings/composition-based style analysis (HBSA):
determination by averaging/comparing security selected characteristics
(dimensions);
2.1. For value:
high earnings volatility (cyclical firms), finance, utility, basic &
energy
2.2. For growth:
technology & health care
|
|
RBSA
|
HBSA
|
|
1.
Low cost & data, quick execution
2.
Could be misleading, many
solutions
3.
Focus on full portfolio
|
1.
Subjective, data intensive
2.
Detect style drift
quickly
3.
Focus on securities
|
|
Style box: (market caps) x (styles) matrix;
sub-detailed HBSA
Style drift: leads to outside exposure/expertise
problems
|
|
Socially responsible investing (SRI): ethical, social, religious; positive/negative
screens (look for/avoid); tilt toward small-cap growth stocks
|
|
1.
Long strategies: buy undervalued stock, avoid
overvalued; asymmetric active weight distribution (- bi limits)
2.
Long-short strategies: buy undervalued stock, sell
overvalued stock (2 alphas, long-short spread); symmetric active
weight distribution; can use market neutral strategy, pairs trade
(arbitrage) with beta = 0 & leverage
3.
Equitizing a market neutral portfolio (100/0 + 20/20):
cash + long/short
�+ (long equity futures or ETFs)/cash; portable
alpha (transportable); seen as alternative investment
4.
Short extension/partial long-short strategy (120/20):
typically beta = 1; seen as long-only
substitute
Enhanced indexing strategies: stock-based/derivative-based
(yield & duration play, lower IB than stocks)
|
Short side price inefficiencies (overvaluation):
1.
Barriers: find security
lender
2.
Accounting manipulation to look better (performance)
3.
More buy than sell recommendations
by sell-side analysts:
buyers
> sellers; not anger large stockholders; firm management pressure
(cut off communications &� investment banking/corporate finance deals,
lawsuits)
Sell disciplines (after tax): opportunity cost (substitution),
deteriorating fundamentals, valuation level, down-from-cost,
up-from-cost, target price
|
|
Fundamental law of active management:
Information coefficient (IC): knowledge depth, forecast/actual return
correlation
Investor breadth (IB): number of independent investment
decisions
|
Information ratio:

|
|
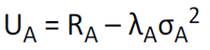
Optimal allocation:
active return, risk aversion,
active risk (variance)
Higher aversion to active
than total risk:
1.
Pick possible active manager to produce possible
active return
2.
Take away positions from judged
passive index
3.
High active return needs focus
on highest active manager (less diversification)
1.
Core-satellite approach: active risk mitigated by core
(passive/enhanced investor benchmark) & active return added by the
satellites (manager portfolios); uncorrelated manager active
returns
2.
Completeness fund: combined with manager active
portfolios to make risk exposures similar to the investor benchmark;
neutralizes misfit risk; passive/semiactive indexing of fund &
regular rebalancing
|
Active return:
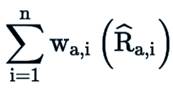
|
Active risk (uncorrelated returns):
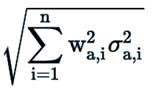
|
|
Total active return = true active return (A) + misfit active
return (S)
Manager true active return =
total return (P) - normal/neutral portfolio (B)
Manager misfit active return =
normal portfolio (B) - investor benchmark (M)
Total active risk = 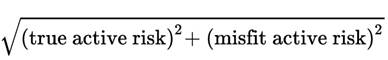
True information ratio (IR) = (true active) / (true active risk)
Optimization objective: maximize total active return with given
level of total active risk with optimal amount of misfit risk (not
0)
|
|
Alpha & beta separation approach: systematic
risk exposure (beta) through low-cost index fund/ETF + portable
alpha through long/short strategy (more expensive); use of derivatives
if restrictions; clear separation of risks
1.
Buy-side (private) vs sell-side (public) research
2.
Top-down approach: macroeconomic
3.
Bottom-up approach: stock & industry level
|
Manager selection: quantitative (style, valuation) &
qualitative considerations
1.
Past performance (quant): evidence of superior results (not proof)
2.
Manager questionnaires: manager staff/organization;
investment philosophy/process; resources (research &
trading); performance; fees
3.
Fee schedules (quant): sliding ad valorem (AUM);
performance-based (more complicated, volatile, align interests if symmetric),
fee caps, high water mark provisions (cover negative return
first)
|
SS14
RISK MANAGEMENT
R25 Risk Management
|
Take necessary risks
(information/advantage to generate return), reduce/eliminate (hedge),
avoid unnecessary risks
Risk management process: continuous analysis & data update
1.
Identify & measure specific risk exposures
2.
Define specific tolerances (will/able to bear)
& adjust risk levels (upward/downward execution)
3.
Report risk exposures to stakeholders
(capital/risk budgeting)
4.
Monitor (limits) & take corrective actions (long-run
issues)
Risk governance (corporate governance): overall process to develop
& put a risk management system (infrastructure) into
use
1.
Transparent, clear
accountability, cost efficient, outcome effective
2.
Decentralized (business units); centralized (top-down,
aggregate diversified firm-wide risk, overall VaR, economies of
scale, ERM)
3.
Front office (trading & sales); back office (administrative,
transaction processing, record keeping, regulatory compliance, custodian
relations, STP)
|
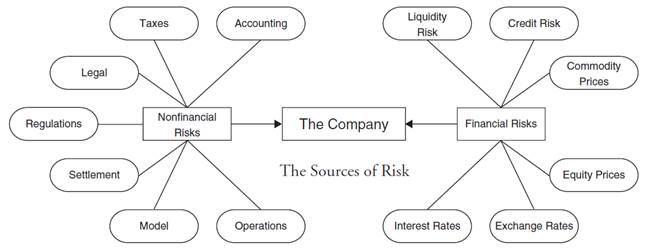
Financial risks (high > low):
1.
Market risk: interest rates, exchange rates,
equity prices, commodity prices
2.
Credit risk: debtor default on promised payment
3.
Liquidity risk: bid-ask spread, trading volume
(often not in valuation)
Non-financial risks:
1. Operational
risk: loss due to failure in company processes or from external
events
2. Model risk:
bad inputs & assumptions
3. Settlement
(Herstatt) risk: counterparty failure to deliver its obligation
(asset/payment) in a transaction
4. Legal/contract
risk: legal contract enforcement, litigation
5. Regulatory
risk: regulation
6. Tax/accounting
risk: laws/rules, taxes, reporting (IASB)
7. Sovereign/political
risk: government willingness/ability to pay (financial), political
conditions
Other risks: ESG risk, performance netting
risk (multimanager asymmetric fee), settlement netting risk
(challenged netting in liquidation)
|
|
 � � � �
|
|
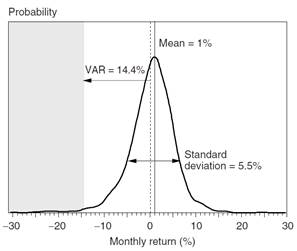
Value at Risk (Var): minimum expected $/%
value loss (to be exceeded) for a given probability
(confidence level) over a specified time period; downside left tail;
industry standard & part regulatory
�
|loss| >= |VaR|
�
z (score) = (x - μ)/σ
single tail: 5% is 1.65 σ, 2.5%
is 1.96 σ,� 1% is 2.33 σ
�
n (periods): R/n & σ/√n; 250 days, 52 weeks, 12
months
�
1.
Analytical VaR method: parametric variance-covariance,
normal distribution; easy to compute/understand, mostly used
 (positive z for 1 - Prob) (positive z for 1 - Prob)
many covariances, issues in leptokurtosis
& skewness (delta-normal method adjustment)
2.
Historical VaR method: nonparametric, rank/quantile past
data returns (sample); easy to compute/understand; data intensive, past
not future
3.
Monte Carlo VaR method: parametric computer simulation, rank/quantile
generated data returns; input assumptions (many solutions, GIGO,
overconfidence), difficult, computation intensive & expensive
VaR used in/with: capital/risk budgeting
(allocation to business units), projections backtesting, before/after
effect incremental VaR (IVaR), cash flow at risk (CFaR), earnings
at risk (EaR), tail VaR (TVaR) = average of losses beyond VaR,
credit VaR (CVaR), stress testing
|
Stress testing: focus on extreme adverse
outcomes
1.
Scenario analysis: different states, model
variables/(risk) factors; use of actual extreme & hypothetical
events; potential weaknesses/inability to accurately measure simultaneous
shifts, causal relations & correlation change effects on
factors
1.1. Stylized
scenarios (type involving at least 1 change in):
�
Interest rates: yield curve levels (parallel shifts
& twists, swap spreads), volatilities
�
Exchange rates: key FX levels, volatilities
�
Stock prices: equity index levels, volatilities
�
Commodity prices
2.
Stressing models (scenario analysis extension): range of
states
2.1. Factor push:
simple combination of (simultaneous) most disadvantageous
shifts in factors (independent)
2.2. Maximum loss optimization: math & computer modelling,� sophisticated
worst combination of factors (dependent)
2.3. Worst-case scenario analysis: likely to occur
Credit risk (default probability, expected loss):
current (jump-to-default) vs potential;
cross-default-provisions (default on all & other creditors); linked to market
risk
|
SS16
TRADING, MONITORING & REBALANCING
R29 Execution of Portfolio Decisions
|
Market order: immediate; execution certainty, price uncertainty
Limit order: execution at the limit price or better that
expire; (partial/full) execution uncertainty, (price certainty)
|
Inside/market spread = quoted ask - quoted bid
Midquote = (quoted ask + quoted bid) / 2
Effective spread = |execution average price - midquote| * 2, leads
to price improvement or price/market impact; simple/volume-weighted average
|
|
1.
Brokered markets: search by agent (in illiquid markets); block
trading (upstairs market, listed on OTC 3rd market)
2.
Quote-driven/dealer markets: (closed-limit order book)
over the counter (OTC) market; bridge liquidity by sell-side
traders/market makers
3.
Order-driven markets:
3.1. Auction markets: natural liquidity by buy-side traders/investors;
competitive price discovery, periodic/batch vs continuous market
3.2. Automated auctions: same but computerized, Electronic Communication Networks (ECNs)
3.3. Electronic crossing networks: batch cross matching at midquote at fixed points in
time; no price discovery, low cost, anonymous, institutional (4th
market)
4.
Hybrid markets: ex NYSE - specialists, call/batch at open
& close
|
|
Dealer: sell-side principal, inventory, liquidity,
bid-ask spread, adverse selection risk
Broker: sell-side agent of buy-side,
commission
1.
Represent the order (principal-agent relationship)
2.
Find/be counterparty (principal trade)
3.
Supply market information
4.
Provide secrecy & discretion
5.
Provide other supporting services
(prime brokerage)
6.
Support the market process
|
Market quality (quantitative, qualitative):
1.
Liquidity: low costs - small bid-ask spreads, market depth,
resilience; factors - many buyers & sellers, diversity of opinions,
convenience, integrity
2.
Transparency: pre-trade (quotes, spread) & post-trade
(completed transactions) information availability
3.
Assurity of completion: clearing & settlement guaranties
|
|
Explicit costs: commissions, taxes, stamp duties & fees
Implicit costs: bid-ask spread, price/market impact
cost, missed trade opportunity cost, delay (slippage) cost;
require a benchmark
VWAP: share volume weighted average of execution
prices for a trading period (benchmark); better than midquote, open &
close prices
|
|
Implementation shortfall (IS) costs = (OC + DC + MC) + EC
IS for a buy [+] = (paper portfolio - gross actual portfolio) +
EC
= paper portfolio - net actual
portfolio
IS for a sell [-] = (gross actual portfolio - paper portfolio) +
EC
1.
OC: missed trade opportunity
cost (unrealized profit/loss)
2.
DC: delay cost (slippage
cost)
3.
MC: realized profit/loss
(market impact cost)
4.
EC: explicit costs
(commissions �)
|
Decision Price, Arrival Price, Execution Price,
Cancellation Price
|
DP
|
AP
|
EP
|
CP
|
|
|
Paper
portfolio
|
|
Not
filled
|
OC
|
|
Filled
|
DC
|
MC
|
Gross
actual portfolio
|
|
|
|
EC
|
Net
actual portfolio
|
|
|
|
|
|
|
|
|
Costs: total or per share $, %,
bp
Market adjusted IS = IS - beta(Rp) * Rm
|
|
|
VWAP
|
IS
|
|
Advantages
|
1.
Easy to understand
2.
Easy & quick to compute
3.
Good for comparing smaller
trades in nontrending markets
|
1.
Links trading to portfolio
management (cost/value)
2.
Useful in portfolio
optimization (performance)
3.
Recognizes time/price
tradeoff
4.
Allows cost attribution/decomposition
5.
No gaming
|
|
Disadvantages
|
1.
No account for delay or opportunity
costs
2.
Can be gamed
3.
Not good for substantial trades in trending
markets
|
1.
Requires extensive data
& analysis
2.
Unfamiliar to traders
|
|
Econometric models estimate trading costs (regression) nonlinearly
related to:
1.
Liquidity: trading volume & frequency, market cap, index
membership, spread, price level
2.
Trade size relative to available liquidity
3.
Momentum (up-down market)
4.
Risk (stock volatility)
5.
Trading style (aggressive, passive)
|
Usefulness in:
1.
Trading effectiveness: comparing actual (ex-post) costs to forecasted
(ex-ante) costs to assess execution quality
2.
Portfolio management: trade size/position determination (cost/value)
|
|
Traders
|
Motivation
|
Preference
|
Order Type
|
|
Information-motivated
|
Time sensitive information
|
Time
|
Market
|
|
Value-motivated
|
Security misvaluation
|
Price
|
Limit
|
|
Liquidity-motivated
|
Liquidity & reallocation
|
Time
|
Market
|
|
Passive
|
Liquidity & rebalancing
|
Price
|
Limit
|
|
Others: dealers, day traders
|
|
|
|
|
|
|
Trading focus/tactic
|
Strengths
|
Weaknesses
|
Motivation
|
|
Liquidity-at-any-cost
|
Quick, certain execution
|
High costs, info leakage
|
Information & liquidity
|
|
Costs-are-not-important
|
Quick certain execution at fair market
price
|
Loss of costs control
|
Various
|
|
Need-trustworthy-agent
|
Broker skill, time to obtain lower price
|
High commissions, info leakage
|
Not information
|
|
Advertise-to-draw-liquidity
|
Price, sunshine trades
|
High admin costs, front running
|
Not information
|
|
Low-cost-whatever-the-liquidity
|
Price
|
Uncertain timing, bad news
|
Value & passive
|
|
Algorithmic trading: automated quantitative systems using rules,
benchmarks & constraints to exploit market patterns (price/volume)
and minimize trading costs & risks
1.
Logical participation strategies:
1.1. Simple logical participation strategies: VWAP, TWAP, percentage
of volume (POV); small break up through time, minimize
market impact costs by matching or improving upon the benchmark
1.2. Implementation shortfall strategies: quick & early
(front-loaded), high market impact costs vs high volatility of delay
& opportunity costs tradeoff considering risk aversion;
objective function to minimize total cost & its variance;
full portfolio
2.
Opportunistic (participation) strategies: passive with
opportunistic liquidity seizing
3.
Specialized strategies: passive, hunter, market on close price
target, smart routing & others

Strategy choice driven by: relative(%) order size, bid-ask spread,
urgency of the trade
|
|
Best execution (prudence): use of best means to trade securities
1.
Linked to investment decision
(cost/value)
2.
Not known with certainty ex-ante, depends on
circumstances & parties
3.
Assessed ex-post over time
4.
Ongoing & integrated with relationships
& practices
|
Trade management guidelines:
1.
Processes: have formal policies & procedures
that assist in best execution
2.
Disclosures to (potential) clients periodically:
2.1. Information on trading techniques, venues, agents
2.2. Conflicts of interest related to trading
3.
Record keeping:
3.1. Compliance with policies & procedures
3.2. Disclosures
to clients
|
|
Buy-side traders:
1.
Should always act in the best
interests of clients (first)
2.
Have a fiduciary duty to
maximize portfolio value
|
Trust is more important now: lower commissions,
agency/explicit to adversarial/implicit cost shift; new tech
venue complexity & anonymity
|
SS17
PERFORMANCE EVALUATION
R31 Evaluating Portfolio Performance
|
Performance evaluation: fund sponsor/investment manager perspective;
feedback & control mechanism linked to IPS, effectiveness check
1.
Performance measurement
(quantification of return, what)
2.
Performance attribution
(sources of return, how)
3.
Performance appraisal
(raisons for return, why)
|
External CF: [+] contribution, [-] withdrawal
|
|
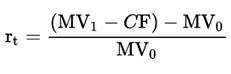
At end, MV1 after CF
|
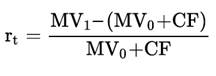
At start, MV0 before CF
|
|
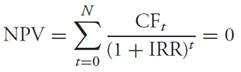
MWR (IRR): cash/return dependent, return on
average investment
TWR (GM): return per unit of money, data
intensive & expensive
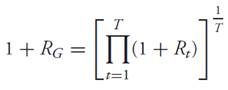
LIRR: chain-linked MWR, approximate TWR
for CF < 10% of value & low volatility
|
Portfolio = Market + Style + Active, A = (P - B),
S = (B - M)
|
|
Benchmarks (asset-based):
1.
Absolute (return objective, MAR, not investable)
2.
Manager universe (only measurable, ambiguous, not
specified/appropriate/investable, survivor bias)
3.
Broad market index (specified, measurable, unambiguous, investable)
4.
Style index (maybe ambiguous, maybe not appropriate, maybe not
accountable)
5.
Factor model-based (ambiguous, maybe not investable, expensive)
6.
Returns-based (maybe not appropriate, maybe not accountable)
7.
Custom security-based (maybe ambiguous)
|
Valid properties (SAMURAI):
1.
Specified in advance
2.
Appropriate (style/expertise)
3.
Measurable
4.
Unambiguous (IDs/weights)
5.
Reflective of current investment opinions (knowledge)
6.
Accountable (owned, accepted)
7.
Investable (replication)
|
|
Custom security-based (strategy) benchmark: expensive to
construct/maintain
1.
Identify manager�s investment process/style
2.
Select securities (including cash)
3.
Weight securities
4.
Review & adjust to process as needed
5.
Rebalance benchmark portfolio on schedule
|
Benchmark quality tests:
1.
Systematic bias: P = beta(1) * B;� Corr(A, S) = 0;� Corr(P - M, S)
= 1
2.
TE(V): low σ(A) < σ (P - M)
3.
Risk characteristics: same exposure to systematic sources of risk
4.
Coverage: high % ratio = (P intersect B) / P
5.
Turnover: low % ratio = (buy-sell of B) / B
6.
Active positions: small (number of) negative active weights
|
|
Hedge funds:
MV0 = 0
|
1.
Value added Rv = Rp - Rb
with separate/sum individual long/short positions
2.
Combine returns-based/holdings-based long &
short benchmarks
3.
Use of absolute return, style/manager
universe benchmarks & Sharpe ratio (but skewness)
|
|
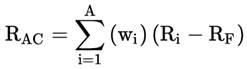
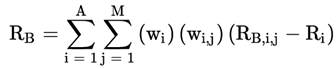
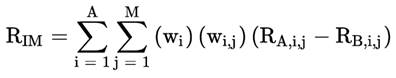
Macro performance attribution ($, % incremental):
1.
Net contributions
2.
Risk free asset
3.
Asset categories (SAA)
4.
Benchmarks (TAA, style bias, misfit return)
5.
Investment managers (active return)
6.
Allocation effects (plug)
|
Inputs: policy allocations; benchmark returns; fund
returns, valuations, external CFs
 ������ ������
|
|
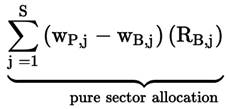
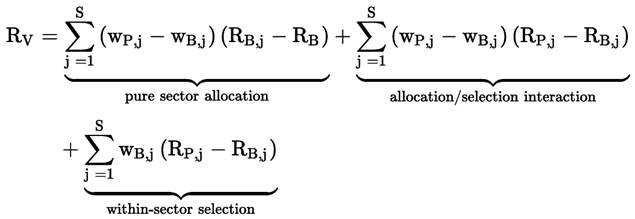
Micro performance attribution (%):
1.
Pure sector allocation:
weighting, [+] * [-] = [-]
���� 
2.
Allocation/selection interaction
3.
Within-sector selection:
stock picking
|
Value added return: Rp - Rb
|
|
Fundamental factor models in micro attribution (many solutions):
 (x 2) (x 2)
1.
Identify fundamental/economic
factors generating systematic returns (market timing,
allocation/selection, sector rotation, company size, growth, leverage,
financial strength)
2.
Determine active exposures
= actual - normal from portfolio & benchmark
(normal portfolio) exposures for each factor at start
3.
Determine the active impact:
added return due to active exposures of the portfolio (not unexplained
return)
|
Fixed-income attribution (external + management):
1.
External interest rate effect: expected + unexpected return
on a passive default free bond benchmark
2.
Interest rate management effect: duration, convexity, yield curve
shape change
3.
Sector/quality effect (allocation/weighting)
4.
Security selection effect (picking)
5.
Trading activity effect (plug)
|
|
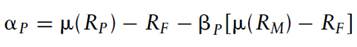
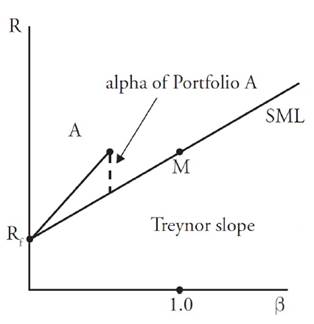
Risk adjusted performance appraisal measures (ex-post):
1.
Jensen�s alpha (SML):
|
|
|
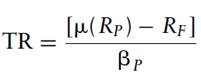
2.
Treynor ratio (SML):
|
3.
Sharpe ratio (CAL):
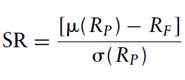
|
|
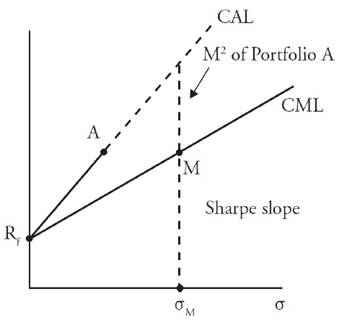
4.
M2 measure (CAL):
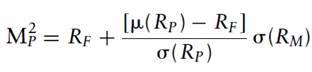
|
5.
Information ratio (IR):
active return / active risk TE(V)
|
|
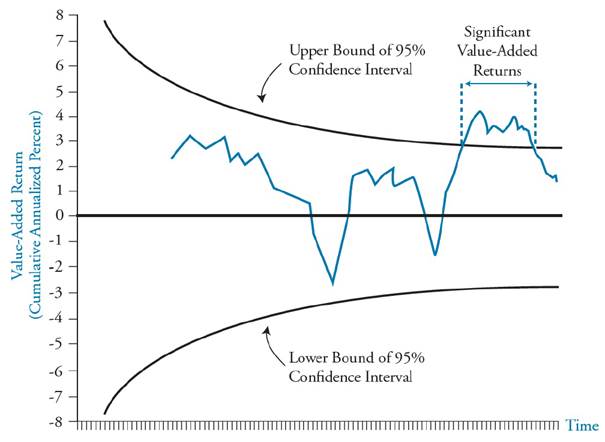
Manager Continuation Policy (MPC): manager continual monitoring &
periodic review
Value added return = portfolio - benchmark (independent,
normally distributed, consistent)
1.
H0: manager adds no value, Rv = 0 (null
hypothesis)
2.
HA: manager adds value (alternative
hypothesis)
1.
Type I error: rejecting the null when true,
keeping bad manager; P(T1)
> P(T2)
2.
Type II error: accepting (failing to reject) the null
when false (& HA true), firing (not keeping) good
manager; P(T2) > P(T1)
Quality control chart:
|
SS1 | SS8 | SS9
| SS12 | SS14 | SS16 | SS17
|